How to Set Up Analytics to Track Business Growth
How to Set Up Analytics to Track Business Growth

Analytics for business growth is defined as configuring measurement systems that reveal real revenue impact, customer behavior, and marketing effectiveness in clear, usable ways. Most small business owners track website traffic and stop there. That gap between traffic data and actual growth insight is where businesses stall. To set up analytics track business growth effectively, you need to measure the metrics that connect directly to revenue, not just page views. This guide walks you through the right metrics, the right tools, and the weekly habits that turn raw data into real decisions.
Which growth metrics should small businesses track?
The most common analytics mistake is measuring the wrong things. Page views and social followers feel good but tell you almost nothing about whether your business is growing. True growth metrics answer one question: is the business actually getting bigger, and at what rate?
Two metrics stand above the rest for small businesses.

Customer Acquisition Cost (CAC) Payback Period measures how many months it takes to recover what you spent to acquire a customer. A healthy CAC Payback Period is 12 months or less, with best-in-class businesses achieving 5 months or less and growing annual recurring revenue 3.2 times faster. If your payback period stretches past 12 months, your marketing spend is outpacing your returns.
Monthly Recurring Revenue (MRR) growth rate tells you how fast your revenue base is compounding. Best-in-class early-stage businesses achieve 10–20% month-over-month MRR growth, while 8% or more is considered healthy. At 15% monthly growth, a business at $10,000 in annual recurring revenue can reach $1,000,000 in roughly 30 months. That compounding effect is why tracking MRR growth weekly matters.
Beyond these two, focus your dashboard on:
- Conversion rate by traffic source (which channels actually produce customers)
- Customer lifetime value versus acquisition cost
- Churn rate for any subscription or repeat-purchase business
- Revenue per visitor for e-commerce or service booking sites
Drop any metric that does not connect to a revenue or retention outcome. Vanity metrics consume your attention without improving your decisions.
What tools and prerequisites do you need to implement business analytics?
The right foundation makes every later step faster and more reliable. For most small businesses, Google Analytics 4 (GA4) is the correct starting point. It is free, widely supported, and built around event-based tracking that maps naturally to how customers actually behave on a site.
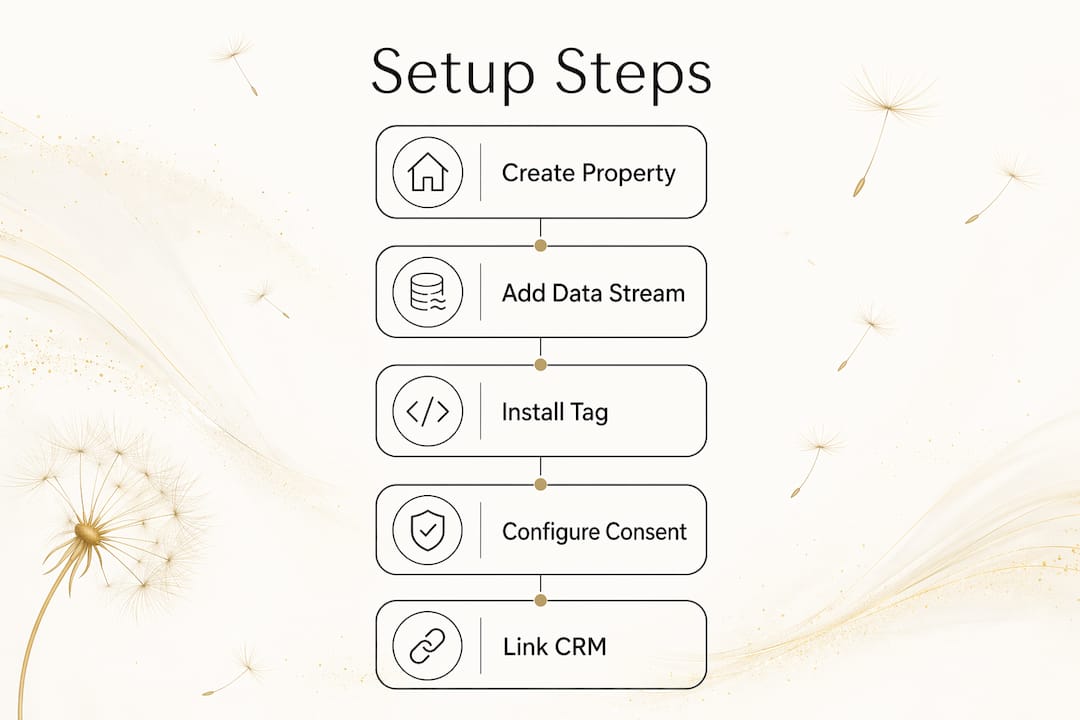
Before you install anything, confirm these three prerequisites are in place:
| Prerequisite | Why it matters |
|---|---|
| Measurement ID and data stream | Connects your website to the correct GA4 property |
| Consent management platform | Required for legal compliance and accurate data collection |
| Server-side tag container | Recovers events lost to ad blockers and browser restrictions |
The consent management piece is not optional in 2026. Regulations in multiple markets require explicit user consent before behavioral data is collected. A consent management platform handles that automatically.
Server-side tagging deserves special attention. Without server-side tagging, client-side tags recover only 65–70% of analytics events, meaning 30–35% of your data disappears before it reaches your reports. A properly configured server-side Google Tag Manager container recovers over 90% of those events. That difference directly affects how you read paid marketing ROI and revenue attribution.
Linking GA4 to your CRM and email marketing platform adds another layer of clarity. When you can see that a specific email sequence produced 14 booked calls, you stop guessing about what works.
Pro Tip: Set up a separate GA4 property for your staging or development site from day one. Mixing test traffic with real data corrupts your reports in ways that are hard to untangle later.
How to set up analytics step by step
A clean setup takes less than two hours if you follow the right sequence. Skipping steps creates data gaps that compound over time.
-
Create one GA4 property per business domain. One property, one data stream per domain. Multiple streams on one property create duplicate event counts that inflate every metric you track.
-
Install your tag via Google Tag Manager. Add the GA4 configuration tag to your GTM container and publish. Avoid hardcoding the GA4 snippet directly into your site’s HTML. GTM gives you control to add, edit, and test tags without touching code.
-
Verify real-time activity. Open the GA4 Realtime report and visit your site from a separate device. At least one active user should appear within 30 seconds. If nothing shows up, your tag is not firing correctly.
-
Configure conversion events. Mark the events that represent real business outcomes as conversions: form submissions, purchase completions, phone call clicks, and appointment bookings. Tracking conversions like leads and purchases gives you far better ROI insight than tracking page views alone.
-
Filter internal traffic. Create an internal traffic filter using your office IP address. Without this, your own visits inflate session counts and distort engagement metrics.
-
Apply consistent UTM tagging. Every paid ad, email campaign, and social post should carry UTM parameters. Without them, GA4 attributes that traffic to “direct,” and you lose visibility into which channels drive growth.
-
Enable BigQuery export. GA4’s standard interface samples data in large reports. BigQuery export gives you unsampled, raw event data for long-term analysis. For a small business running fewer than 10 million events per month, the export is free.
Pro Tip: Build a simple UTM naming convention document and share it with anyone who runs campaigns for your business. Inconsistent UTM tags like “Email” versus “email” split your data into separate rows and make channel reports unreliable.
For a broader view of what your online visibility checklist should include alongside analytics, Moderatemurmurations has a practical guide built for small business owners.
How do you turn analytics data into weekly growth decisions?
Data sitting in a dashboard does nothing. The businesses that grow fastest treat analytics as a decision tool, not a reporting tool. Business analytics should move beyond dashboards to answer “What should we do about it?” through predictive models and automated follow-ups.
You do not need a data analyst to make this work. A structured weekly review takes five minutes and produces one clear action.
The 5-minute weekly review follows this pattern:
- Compare the last 7 days against the previous 7 days
- Check traffic acquisition to see which channels grew or shrank
- Review your top landing pages by conversion rate, not just visits
- Note which pages show the highest engagement time
- Write down one change you will make based on what you saw
That last step is the one most business owners skip. Writing down one specific action, whether it is updating a landing page headline, pausing a low-converting ad, or adding a call-to-action to a high-traffic post, creates a feedback loop between your data and your results.
“Small businesses gain the highest return by focusing their analytics setup on a small set of critical KPIs and regularly reviewing these with a disciplined routine. Dashboards that track 30 metrics produce paralysis. Dashboards that track 5 produce decisions.”
The role of automation in scaling becomes clear once your weekly review identifies repeating patterns. When the same traffic source consistently converts at twice the rate of others, that is a signal to automate follow-up sequences for that channel.
What are the most common analytics setup mistakes?
Most analytics problems trace back to a small number of setup errors. Catching them early saves weeks of bad data.
- Tags not firing on all pages. A tag placed only on the homepage misses every conversion that happens deeper in the site. Test from multiple entry points, not just the home URL.
- Ad blockers silently dropping events. Standard client-side tags are blocked by a growing share of browsers. Server-side tagging is the fix, not a workaround.
- Consent banners blocking all tracking. If your consent setup defaults to “deny all” before the user responds, you lose data on every visitor who bounces before clicking. Configure your consent management platform to collect anonymous, non-personal signals by default where regulations permit.
- Conversion events that do not represent real outcomes. Marking “page view” or “scroll depth” as a conversion inflates your conversion rate and makes every channel look better than it is. Conversion events should represent actual business outcomes: a booked call, a completed purchase, a submitted form.
- No filter on internal traffic. Your own visits to your site, especially during testing, add sessions that skew engagement and bounce rate data. Set the internal traffic filter before you start reading reports.
Fixing these five issues puts you ahead of the majority of small business analytics setups. Clean data is the prerequisite for every good decision that follows.
Key Takeaways
Setting up analytics to track business growth requires the right metrics, a clean technical foundation, and a weekly review habit that produces one clear decision per session.
| Point | Details |
|---|---|
| Track revenue-linked metrics | Focus on CAC Payback Period and MRR growth rate, not page views or social followers. |
| Use server-side tagging | Client-side tags lose 30–35% of events; server-side setups recover over 90% of that data. |
| Configure conversion events correctly | Mark only real business outcomes as conversions: purchases, leads, and booked calls. |
| Run a 5-minute weekly review | Compare 7-day periods, check acquisition channels, and write down one change to make. |
| Filter noise from the start | Block internal traffic and apply consistent UTM tags before reading any reports. |
What I’ve learned from watching small businesses set up analytics
Most small business owners I work with arrive with the same problem. They have GA4 installed, they check it occasionally, and they have no idea whether their business is growing or why. The dashboard is full of numbers that do not connect to anything they can act on.
The shift that changes everything is moving from traffic counting to outcome tracking. Once you configure real conversion events and start comparing acquisition channels by conversion rate rather than visit volume, the data starts telling a story. You stop asking “how many people visited?” and start asking “which channel produced paying customers this week?”
Server-side tagging felt like an advanced topic two years ago. In 2026, it is table stakes. The businesses that skip it are making decisions on data that is missing 30% of its events. That is not a minor gap. It is the difference between seeing that your paid ads are breaking even versus seeing that they are actually profitable once recovered events are counted.
My honest recommendation: start with five metrics, not fifteen. Set up your weekly review before you set up your first dashboard. The discipline of a consistent review routine matters more than the sophistication of your reporting setup. You can always add complexity later. You cannot recover months of decisions made on incomplete data.
If you are just getting started, the content strategy examples guide from Moderatemurmurations pairs well with your analytics setup. Understanding what content to produce and how to measure its impact are two sides of the same growth system.
— Christopher
Analytics setup is part of how Moderatemurmurations builds your growth system
Moderatemurmurations builds fast, clean websites and digital systems for small businesses, creators, and service providers. Analytics setup is built into that process, not added as an afterthought.

When you launch your business online with Moderatemurmurations, your site ships with a properly structured GA4 property, conversion events configured to your actual business goals, and a clean tagging setup that gives you decision-grade data from day one. No patching things together after the fact. If you want to see exactly what that build process looks like, the full service details are on the build page. Getting started is straightforward, and the result is a digital presence that actually tells you what is working.
FAQ
What is the first step to set up analytics for a small business?
Create a Google Analytics 4 property, add one data stream for your domain, and install the tracking tag through Google Tag Manager. Verify the setup by checking the Realtime report from a separate device.
How do I know which metrics actually measure business growth?
Focus on metrics tied directly to revenue and retention: CAC Payback Period, MRR growth rate, conversion rate by channel, and customer lifetime value. Drop any metric that does not connect to a business outcome.
What is server-side tagging and do I need it?
Server-side tagging routes analytics events through your own server instead of the visitor’s browser. In 2026, it recovers over 90% of events that ad blockers and browser restrictions would otherwise drop, making it necessary for accurate data.
How often should I review my analytics data?
A 5-minute weekly review comparing the last 7 days to the previous 7 days is the most effective routine for small business owners. The goal is to identify one specific change to make based on what the data shows.
Why are my conversion numbers lower than my traffic numbers suggest?
The most common cause is conversion events that do not represent real business outcomes, or missing data from ad blockers and consent issues. Audit your conversion event configuration and consider server-side tagging to recover dropped events.